Smart Commodity Monitoring

The structured commodity financing technique provides liquidity and mitigates counter-party risks for the stakeholders in the origination, production, purchase, and sale of raw, semi-fined, or semi-processed commodities. It requires constant tracking, monitoring, and transparency on the transacted assets like quantities, qualities, locations, and storage and shipping conditions. The classical inspection mechanism demands numerous human interventions for the generation, collection, processing, validation, and exchange of inspection reports. Lags happen because inspectors must travel to storage sites. It occurs that inspectors travel 10-20k km/month to examine commodities in storage in silos and warehouses; it equates to 15-20 tons of CO2/year and to 50-60 tons with the addition of direct fuel combustion emissions and grey emissions. Our smart remote sensing technologies, on the other hand, monitor relevant data 24/7 and use proprietary algorithms to determine the conditions of goods in storage. Our bespoke dashboards display either high-level or detailed information depending on users’ profiles and needs (e.g. inspectors, collateral managers, trade finance officers). Alarms trigger when storage conditions and quantities (masses, volumes) are drifting out of nominal boundaries.

Expert Dashboards

The 24/7 monitoring empowers stakeholders (e.g. collateral managers, trade finance officers, and inspectors). This advanced panel displays tonnage in storage, mass movements over time, and other physical data (e.g. moisture, temperature, vibration patterns, CO2 and other volatile chemicals). Our monitoring algorithms run in the background to detect variations from nominal values (e.g. temperature drifts as a sign of cargo spoilage, unexpected mass releases) and dispatch appropriate alarms to the right staff. The design and customization of dashboards are essential to display only relevant data to staff.
This advanced panel displays an ensemble of (physical) variations and enables inspectors to monitor trends.
This advanced panel displays time series of selected data (e.g. status of storage condition, in green).
This advanced panel displays time series of selected data (e.g. temperature, and relative and absolute humidity).
This advanced panel displays time series of selected data (e.g. temperature, relative and absolute humidity).
This panel displays several storage sites on a map. The user can select sites based, for instance, on location, storage/ commodity type, tonnage, operators and clients. This feature facilitates and accelerates access to relevant information. The user selection displays detailed dashboards accordingly.
When the user selects a specific storage site, only essential (and customizable) information is then displayed for a rapid monitoring overview of the portfolio under consideration.

Our Infrastructure

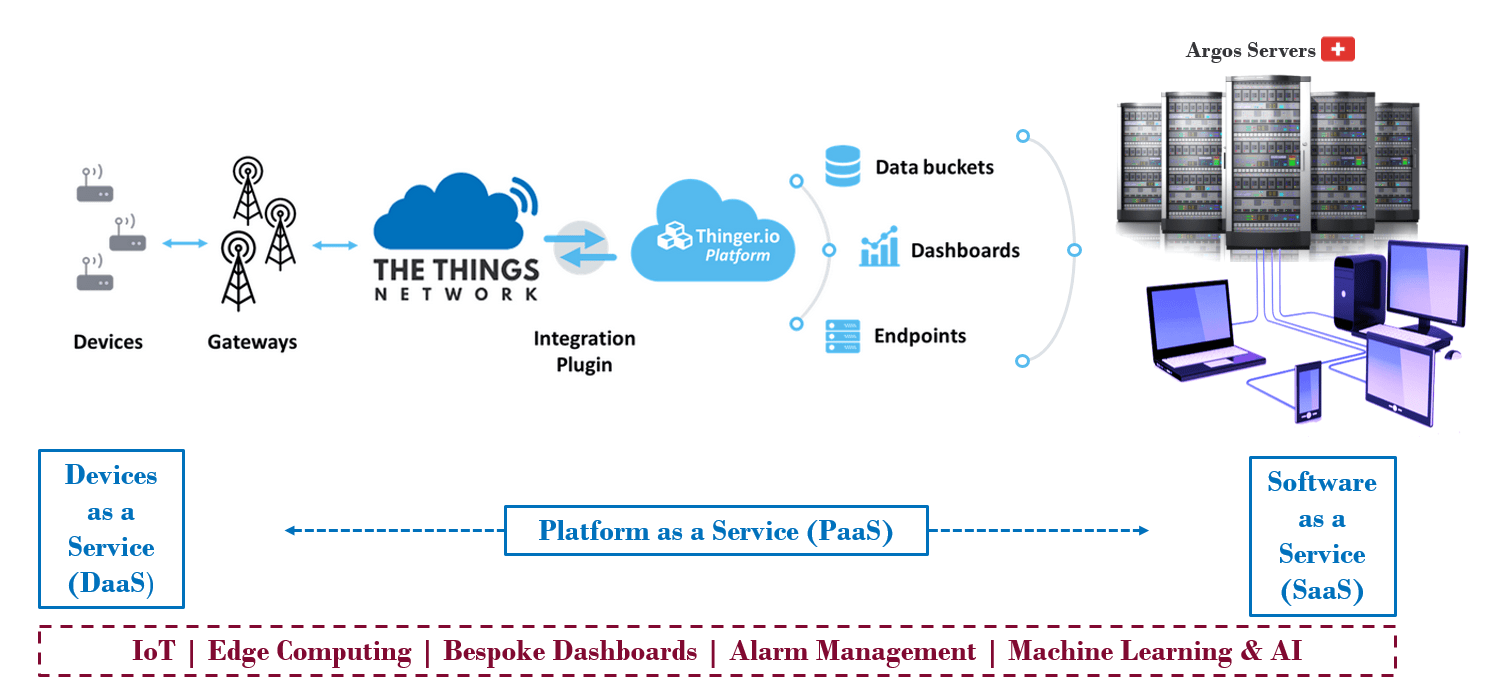
Our infrastructure contains several redundancy nodes to prevent disruption of service. In case of such an event, our engineers, collateral managers, trade finance officers, inspection managers, inspectors, and any other entitled resources are swiftly informed.

This website uses cookies to ensure you get the best experience on our website.
By continuing to browse on this website, you accept our privacy policy.